Matplotlib Tutorial
Matplotlib:
It is a library to create graph plotting in data science.
Import Matplotlib:
Import matplotlib
This line used to import matplotlib.
Find Version:
import matplolib
print(matplotlib.__version__)
This line used to find matplotlib version.
Pyplot:
Most commonly used utility is pyplot.
Import Pyplot:
import matplotlib. pyplot as plt
This line used to import the pyplot module.
Example:
import matplotlib.pyplot as plt
import numpy as npxpoints = np.array([0, 5])
ypoints = np.array([0, 100])
plt.plot(xpoints, ypoints)
plt.show()
Output:
Set Position:
Example:
import matplotlib.pyplot as plt
import numpy as npxpoints = np.array([1, 5])
ypoints = np.array([4, 10])
plt.plot(xpoints, ypoints, 'o')
plt.show()
Output:
Multiple Points:
import matplotlib.pyplot as plt
import numpy as npxpoints = np.array([2,4,7,9])
ypoints = np.array([6,3,8,1])
plt.plot(xpoints, ypoints)
plt.show()
Output:
Default X Points:
import matplotlib.pyplot as plt
import numpy as npypoints = np.array([3, 8, 1, 10, 5, 7])
plt.plot(ypoints)
plt.show()
Output:
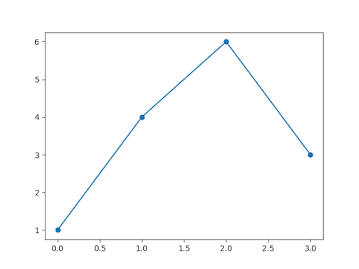
Markers:
import matplotlib.pyplot as plt
import numpy as npypoints = np.array([1,4,6,3])
plt.plot(ypoints, marker = 'o')
plt.show()
Output:
Point the position by the markers code plt.plot(ypoints, marker = 'o')
Marker own symbol:
import matplotlib.pyplot as plt
import numpy as npypoints = np.array([1,4,6,3])
plt.plot(ypoints, marker = '*')
plt.show()
Output:
Line Style:
import matplotlib.pyplot as plt
import numpy as npypoints = np.array([3, 8, 1, 10])
plt.plot(ypoints, linestyle = 'dotted')
plt.show()
Output:
Line Color:
import matplotlib.pyplot as plt
import numpy as npypoints = np.array([3, 8, 1, 10])
plt.plot(ypoints, color = 'pink')
plt.show()
Output:
we can use ,ore colors by using plt.plot(ypoints, color = 'pink')
Line Width:
import matplotlib.pyplot as plt
import numpy as np
ypoints = np.array([3, 8, 1, 10])
plt.plot(ypoints, linewidth = '25.0')
plt.show()
import numpy as np
ypoints = np.array([3, 8, 1, 10])
plt.plot(ypoints, linewidth = '25.0')
plt.show()
Output:
import numpy as np
import matplotlib.pyplot as plt
x = np.array([80, 85, 90, 95, 100, 105, 110, 115, 120, 125])
y = np.array([240, 250, 260, 270, 280, 290, 300, 310, 320, 330])
plt.plot(x, y)
plt.title("Income")
plt.xlabel("Average ")
plt.ylabel("Days")
plt.show()
import matplotlib.pyplot as plt
x = np.array([80, 85, 90, 95, 100, 105, 110, 115, 120, 125])
y = np.array([240, 250, 260, 270, 280, 290, 300, 310, 320, 330])
plt.plot(x, y)
plt.title("Income")
plt.xlabel("Average ")
plt.ylabel("Days")
plt.show()
Output:
We can add labels like this.
Grid Lines:
import sys
import matplotlib
matplotlib.use('Agg')
import numpy as np
import matplotlib.pyplot as plt
x = np.array([80, 85, 90, 95, 100, 105, 110, 115, 120, 125])
y = np.array([240, 250, 260, 270, 280, 290, 300, 310, 320, 330])
plt.title("Income")
plt.xlabel("Average")
plt.ylabel("Days")
plt.plot(x, y)
plt.grid()
plt.show()
Output:
We can add horizontal and vertical lines only by using plt.grid(axis = 'x'),
plt.grid(axis = 'y')
Bar Chart:
import matplotlib.pyplot as plt
import numpy as npx = np.array(["A", "B", "C", "D"])
y = np.array([3, 8, 1, 10])
plt.bar(x,y)
plt.show()
Output:
Histograms:
import sys
import matplotlib
matplotlib.use('Agg')
import matplotlib.pyplot as plt
import numpy as np
x = np.random.normal(150,50,230)
plt.hist(x)
plt.show()
Output:
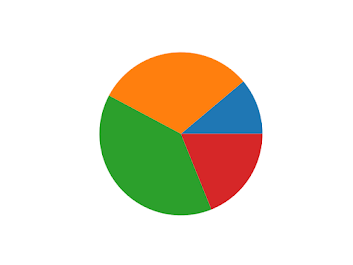
Pie Chart:
import matplotlib.pyplot as plt
import numpy as np
y = np.array([35, 25, 25, 15])
plt.pie(y)
plt.show()
import numpy as np
y = np.array([35, 25, 25, 15])
plt.pie(y)
plt.show()
Output:


No comments:
Post a Comment