Tuesday, May 11, 2021

Matplotlib Tutorial

Matplotlib:

            
                It is a library to create graph plotting in data science.

Import Matplotlib:
                            
                Import matplotlib

This line used to import matplotlib.

Find Version:

                import matplolib
                print(matplotlib.__version__)

This line used to find matplotlib version.

Pyplot:

            Most commonly used utility is pyplot.
            
Import Pyplot:

            import matplotlib. pyplot as plt

This line used to import the pyplot module.

Example:

                import matplotlib.pyplot as plt
        import numpy as np
        xpoints = np.array([0, 5])
        ypoints = np.array([0, 100])
        plt.plot(xpoints, ypoints)
        plt.show()

Output:    


Set Position:

Example:
                import matplotlib.pyplot as plt
        import numpy as np
        xpoints = np.array([1, 5])
        ypoints = np.array([410])
        plt.plot(xpoints, ypoints, 'o')
        plt.show()     

Output:  


      It shows only the position of the x,y points by using 
plt.plot(xpoints, ypoints, 'o')

Multiple Points:

            import matplotlib.pyplot as plt
            import numpy as np
            xpoints = np.array([2,4,7,9])
            ypoints = np.array([6,3,8,1])
            plt.plot(xpoints, ypoints)
            plt.show()

Output:


Default X Points:

            import matplotlib.pyplot as plt
            import numpy as np
            ypoints = np.array([3811057])
                         plt.plot(ypoints)
            plt.show()

Output:


Markers:     

                import matplotlib.pyplot as plt
        import numpy as np
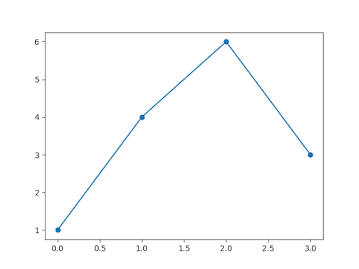
        ypoints = np.array([1,4,6,3])
        plt.plot(ypoints, marker = 'o')
        plt.show()               

Output:


Point the position by the markers code plt.plot(ypoints, marker = 'o')

Marker own symbol:

        import matplotlib.pyplot as plt
        import numpy as np
        ypoints = np.array([1,4,6,3])
        plt.plot(ypoints, marker = '*')
        plt.show()        

Output:


Line Style:

                 import matplotlib.pyplot as plt
        import numpy as np
        ypoints = np.array([38110])
        plt.plot(ypoints, linestyle = 'dotted')
        plt.show()

Output:     


We have more line style like this dashed(), dashdot().


Line Color:

                import matplotlib.pyplot as plt
        import numpy as np
        ypoints = np.array([38110])
        plt.plot(ypoints, color = 'pink')
        plt.show()

Output:


we can use ,ore colors by using plt.plot(ypoints, color = 'pink')

Line Width:

        import matplotlib.pyplot as plt
        import numpy as np
        ypoints = np.array([38110])
        plt.plot(ypoints, linewidth = '25.0')
        plt.show()

Output:

Labels:

        import numpy as np
        import matplotlib.pyplot as plt
        x = np.array([80859095100105110115120125])
        y = np.array([240250260270280290300310320330])
        plt.plot(x, y)
        plt.title("Income")
        plt.xlabel("Average ")
        plt.ylabel("Days")
        plt.show()


Output:


We can add labels like this.

Grid Lines:

        import sys
        import matplotlib
        matplotlib.use('Agg')
        import numpy as np
        import matplotlib.pyplot as plt
        x = np.array([80, 85, 90, 95, 100, 105, 110, 115, 120, 125])
        y = np.array([240, 250, 260, 270, 280, 290, 300, 310, 320, 330])
        plt.title("Income")
        plt.xlabel("Average")
        plt.ylabel("Days")
        plt.plot(x, y)
        plt.grid()
        plt.show()

Output:


We can add horizontal and vertical lines only by using plt.grid(axis = 'x'), 

plt.grid(axis = 'y')

Bar Chart:

        import matplotlib.pyplot as plt
        import numpy as np
        x = np.array(["A""B""C""D"])
        y = np.array([38110])
        plt.bar(x,y)
        plt.show()

Output:


Histograms:

                  import sys
                  import matplotlib
                  matplotlib.use('Agg')
                  import matplotlib.pyplot as plt
                  import numpy as np
                  x = np.random.normal(150,50,230)
                  plt.hist(x)
                  plt.show()

Output:
Pie Chart:

        import matplotlib.pyplot as plt
        import numpy as np
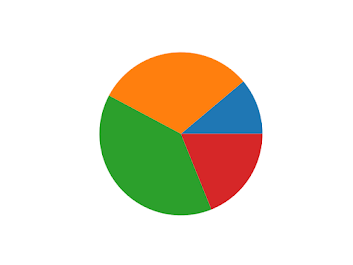
        y = np.array([35252515])
        plt.pie(y)
        plt.show() 

Output:


Sunday, May 9, 2021

Pandas Tutorial                      

Pandas:

        Working with Data sets and Arrays for analyze, clean, and manipulating Data. 

  Import Pandas:

    Coding

        Import pandas as pd  


Example 

Checking pandas version

         Coding

                import pandas as pd

                print(pd.__version__)

This coding used to know about our pandas versions.


Data Frames:

        Example 1:

       Coding

            import pandas as pd

            mydataset = { 'TVs': ["Sony", "Samsung", "LG"], 'Passings': [3, 7, 2]

                                  }

            myvar = pd.DataFrame(mydataset)

            print(myvar)

Output:

                                Tvs                            Passings

            0           Sony                                        3

            1           Samsung                                 7

            2           LG                                           2

In this example we set the data's into data frames

pd.DataFrame(mydataset) Used to set data frames


Find Location:
            
            Coding
                        
                        print(df.loc[1])
Output:

                       TVs Samsung
            Passings          7
            Name: 1, dtype: object

Read CSV File:
                We use csv files or excel, sheets for the data analysis.
                 These files having all the details of the project what we done.
                Store big data's into this csv files.
Example:
               import pandas as pd

        df = pd.read_csv('example.csv')

        print(df.to_string()) 

Output:
            Tvs                            Passings

            0           Sony                                        3

            1           Samsung                                 7

            2           LG                                           2

            3           Panasonic                                4

            4           Mi                                             6

            5           Sansui                                       5

In this Example we read the csv file by using pd.read_csv('example.csv').

It will analyse the all data in the csv file and show all the data's.

Read Json File:

Example:
          import pandas as pd

     df = pd.read_json('Example.json')

     print(df.to_string()) 

Output:
                             Tvs                            Passings

            0           Sony                                        3

            1           Samsung                                 7

            2           LG                                           2

            3           Panasonic                                4

            4           Mi                                             6

            5           Sansui                                       5

In this example we using Json Files.                    
JavaScript Object Notation(JSON) lightweight format for storing and transporting data.
We can resd the Json files by using pd.read_json('Example.json')

Viewing The Data's

head() Function:

Example:
        import pandas as pd

        df = pd.read_csv('Example.csv')

        print(df.head(3))

Output:
                            Tvs                            Passings

            0           Sony                                        3

            1           Samsung                                 7

            2           LG                                           2

head () function used to show first 3 data's of the csv file.

Tail() Function:

               import pandas as pd

        df = pd.read_csv('Example.csv')

        print(df.tail(3))
Output:
                
            3           Panasonic                                4

            4           Mi                                             6

            5           Sansui                                       5

In this tail function used show last data's of the csv file.

Cleaning Data:

            Data cleaning is the process of remove empty cells, Wrong data's, Wrong format data, Duplicate Data's.

Example:
               import pandas as pd

        df = pd.read_csv('example.csv')

        new_df = df.dropna()

        print(new_df.to_string())

dropna() function is used to remove empty cells from our data's.

Wrong format data Correction:

 Example:

        import pandas as pd

    df = pd.read_csv('example.csv')

    df['Date'] = pd.to_datetime(df['Date'])

    print(df.to_string())

Convert wrong format of data into correct format.

In this exapmle used to convert correct format of date.

Wrong Data Correction:

        df.loc[4'Duration'] = 8

In this example we correct the data by its location.

Remove Duplicates:
       
         print(df.duplicated())

this line used to find duplicates.

         df.drop_duplicates(inplace = True)

this line used to drop duplicates.

Correlation:

            df.corr()

this line used to correlate the columns of the datasets.

Numpy Tutorials

 1.Array Create

import numpy as np

a = np.array([12345])

print(a)

Output

[12345]

2.2D Array

import numpy as np

a = np.array([[123], [456]])

print(a)

Output

[[1 2 3]
 [4 5 6]]
3.Array Indexing 1 dimenstional Array
import numpy as np

a = np.array([1, 2, 3, 4])

print(a[0])
Output

1

4.Array Indexing 2D Array

import numpy as np

arr = np.array([[1,2,3], [6,7,8]])

print(a[01])

Output

2

5.Array Slicing 1D array

import numpy as np

a= np.array([12345])

print(a[1:2])

Output

1

6.Array Slicing 1D array Negative Index


import numpy as np

a= np.array([12345])

print(a[-1])

Output

5

7.Array Slicing 2D Array

import numpy as np

a = np.array([[12345], [678910]])

print(a[02:3])

Output

3

8.Dtype

import numpy as np

a = np.array([1234])

print(a.dtype)

Output 

int64

9.Dtype String

import numpy as np

a = np.array(['cat''dog''cherry'])

print(a.dtype)

Output

.
<U6

10.Copy 

import numpy as np

a = np.array([1, 2, 3, 4, 5])
x = a.copy()
a[0] = 7

print(a)
print(x)

Output
[7  2  3  4  5]
[1 2 3 4 5]
11.View

a = np.array([1, 2, 3, 4, 5])
x = a.view()
a[0] = 7

print(a)
print(x)

Output
[7  2  3  4  5]
[7  2 3 4 5]
12.Array Shape Find

import numpy as np

a = np.array([[1, 2, 3], [5, 6, 7]])

print(a.shape)

Output

(2,3)

13.Array reshape

import numpy as np

a = np.array([1, 2, 3, 4, 5, 6, 7, 8, 9, 10, 11, 12])

b = a.reshape(2,6)

print(b)

Output
[[ 1  2  3  4  5  6] 
 [ 7 8 9 10 11 12]]

14. Array For each

import numpy as np

a = np.array([1, 2, 3])

for x in a:
  print(x)

Output
1
2
3

15.Array Joining

import numpy as np

a1 = np.array([123])

a2 = np.array([456])

a = np.concatenate((a1, a2))

print(a)

Output
[1 2 3 4 5 6]

16.Array Split

import numpy as np

a = np.array([123456])

a1 = np.array_split(a, 3)

print(a1)
Output
[array([1, 2]), array([3, 4]), array([5, 6])]
17.Array Search
import numpy as np

a = np.array([1, 2, 3, 4, 5, 4, 4])

x = np.where(a == 1)

print(x)
Output
(array([0]),)
18.Array Sort

import numpy as np a = np.array([3, 2, 0, 1]) print(np.sort(a))

Output
[0,1,2,3]

19.Data Distribution in Numpy


from numpy import random x = random.choice([3, 5, 7, 9], p=[0.1, 0.3, 0.6, 0.0], size=(20)) print(x)

Output

[7 7 5 7 7 7 5 7 7 7 7 5 3 7 5 7 7 7 5 7]


20.Normal Distribution

from numpy import random

x = random.normal(size=(1,2))

print(x)

Output
[[ 0.9638252  -0.66766091]][[ 0.9638252  -0.66766091]]

21.Binomial Distribution

from numpy import random x = random.binomial(n=5, p=0.5, size=5) print(x)

Output

[3,3,2,2,2]

22.Poisson Distribution
from numpy import random

x = random.poisson(lam=2, size=5)

print(x)

Output

[6 1 4 4 2 1 0 1 2 2]
23.chisquare
from numpy import random

x = random.chisquare(df=2, size=(2, 3))

print(x)

Output
[[0.66396936 0.60936515 4.82225736]
 [0.1746385  0.25990412 4.1739717 ]]


Python Technical Interview Questions

 1)first non repeating character Malayalam y programming p str = "MalayalaM" a = '\0' for c in str:     if str.index(c) ==...